Chapter 4 Missing values
In this part, we do some study on the missing value of the dataset. Having better understanding of the missing value and dealing with missing values in feasible ways can help our analysis to be more accurate.
First we can have a quick review of our dataset, we can see clearly that their are many missing values (NA entries) in our dataframe.
4.1 Number of Missing values for each variable
| x | |
|---|---|
| X | 0 |
| date | 0 |
| state | 0 |
| tot_cases | 0 |
| new_case | 0 |
| tot_death | 0 |
| new_death | 0 |
| hospital_onset_covid | 276 |
| inpatient_beds | 201 |
| inpatient_beds_used | 275 |
| inpatient_beds_used_covid | 210 |
| previous_day_admission_adult_covid_confirmed | 6073 |
| previous_day_admission_adult_covid_suspected | 6214 |
| previous_day_admission_pediatric_covid_confirmed | 6478 |
| previous_day_admission_pediatric_covid_suspected | 6474 |
| staffed_adult_icu_bed_occupancy | 6485 |
| staffed_icu_adult_patients_confirmed_and_suspected_covid | 6411 |
| staffed_icu_adult_patients_confirmed_covid | 6261 |
| total_adult_patients_hospitalized_confirmed_and_suspected_covid | 5936 |
| total_adult_patients_hospitalized_confirmed_covid | 5811 |
| total_pediatric_patients_hospitalized_confirmed_and_suspected_covid | 6476 |
| total_pediatric_patients_hospitalized_confirmed_covid | 6476 |
| total_staffed_adult_icu_beds | 6333 |
| inpatient_beds_utilization | 275 |
| percent_of_inpatients_with_covid | 298 |
| inpatient_bed_covid_utilization | 275 |
| adult_icu_bed_covid_utilization | 6644 |
| adult_icu_bed_utilization | 6637 |
From this table we can see clearly that there are 5 columns have about 200 missing values while 14 columns have more than 5,000 missing values.
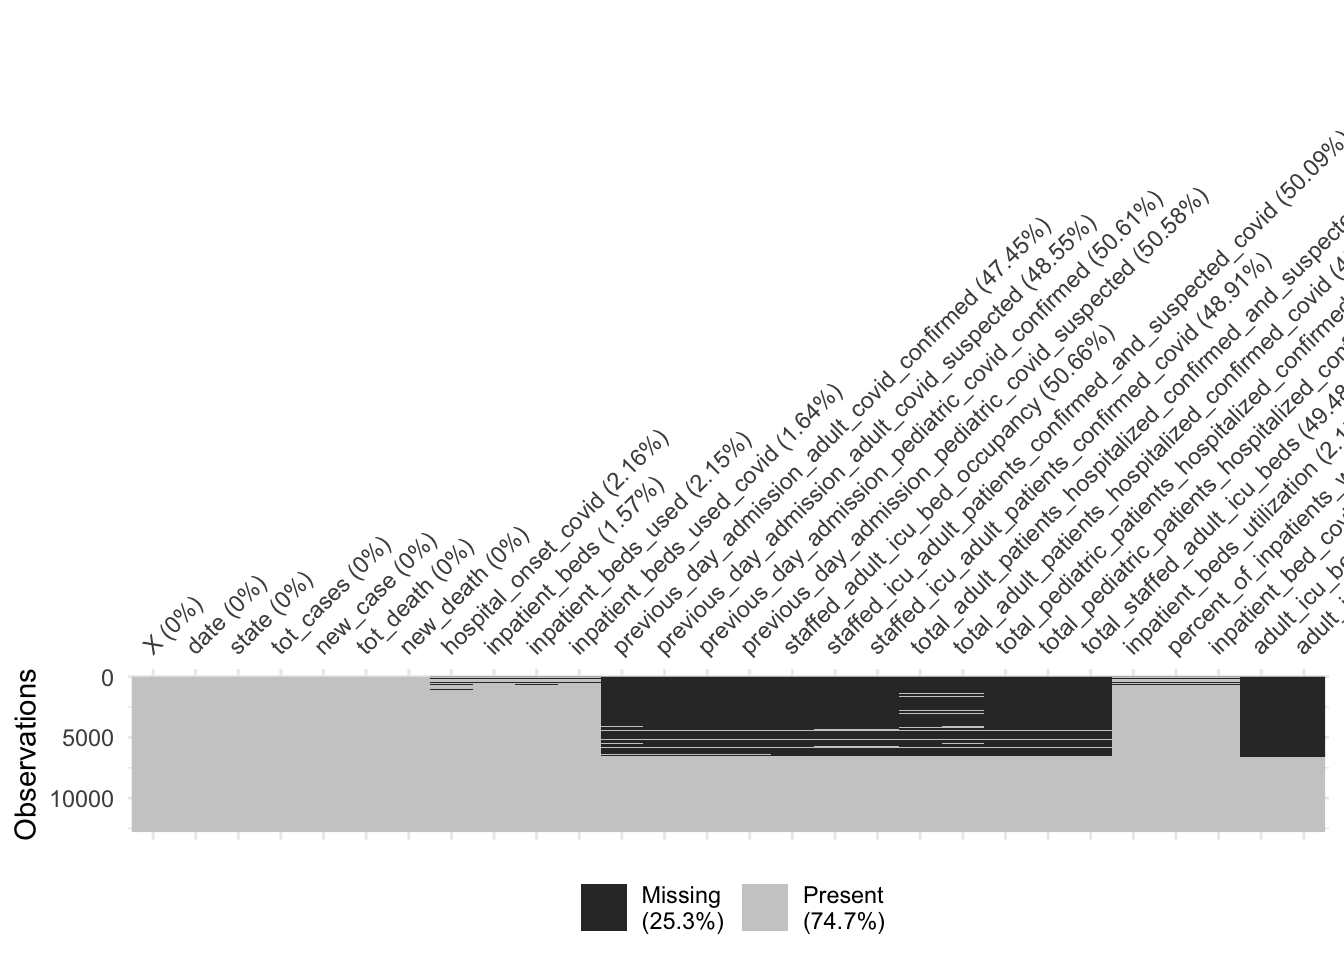
This plot provides a specific visualization of the amount of missing data, showing in black the location of missing values, and also providing information on the overall percentage of missing values overall (in the legend), and in each variable. From this graph we can see that most missing values happen together, they are not random missing values. After diving deeper into the data source, we know that the missing pattern is because states don’t always have consistent data collection methods over time.
4.2 Patterns of Missing values
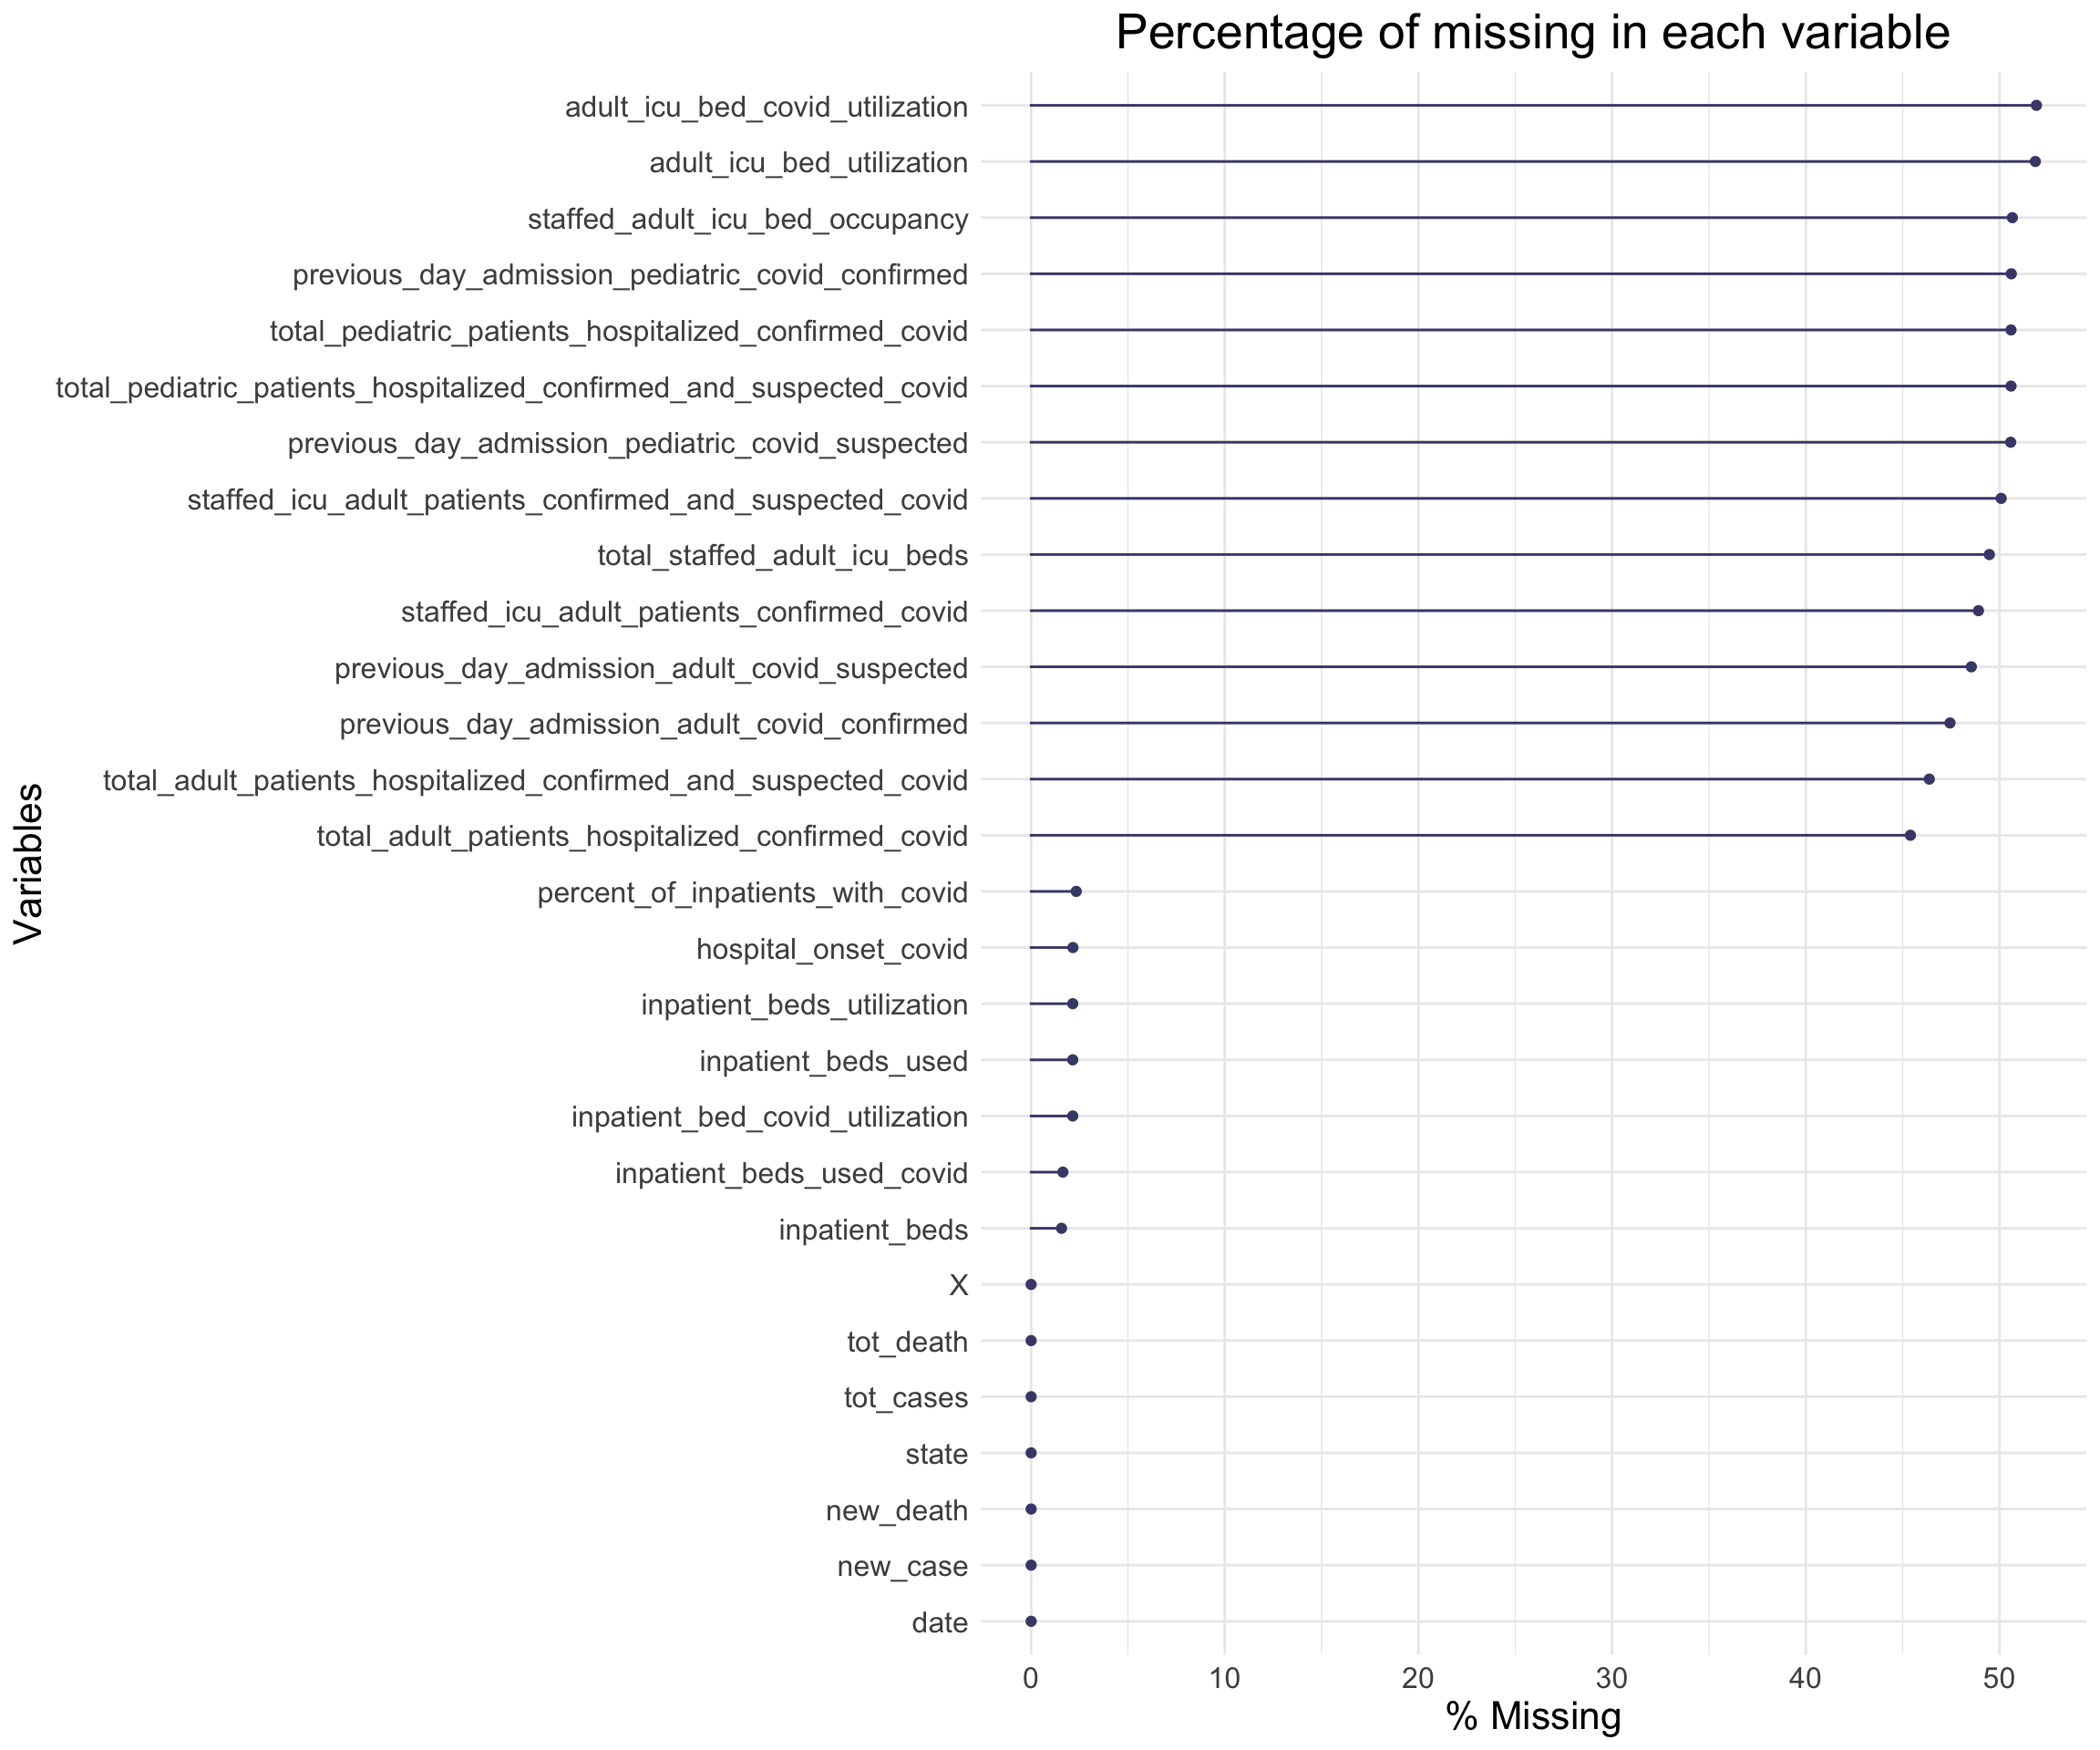
From the plot above, we can see more clear about the percentage of missing values in each variables.
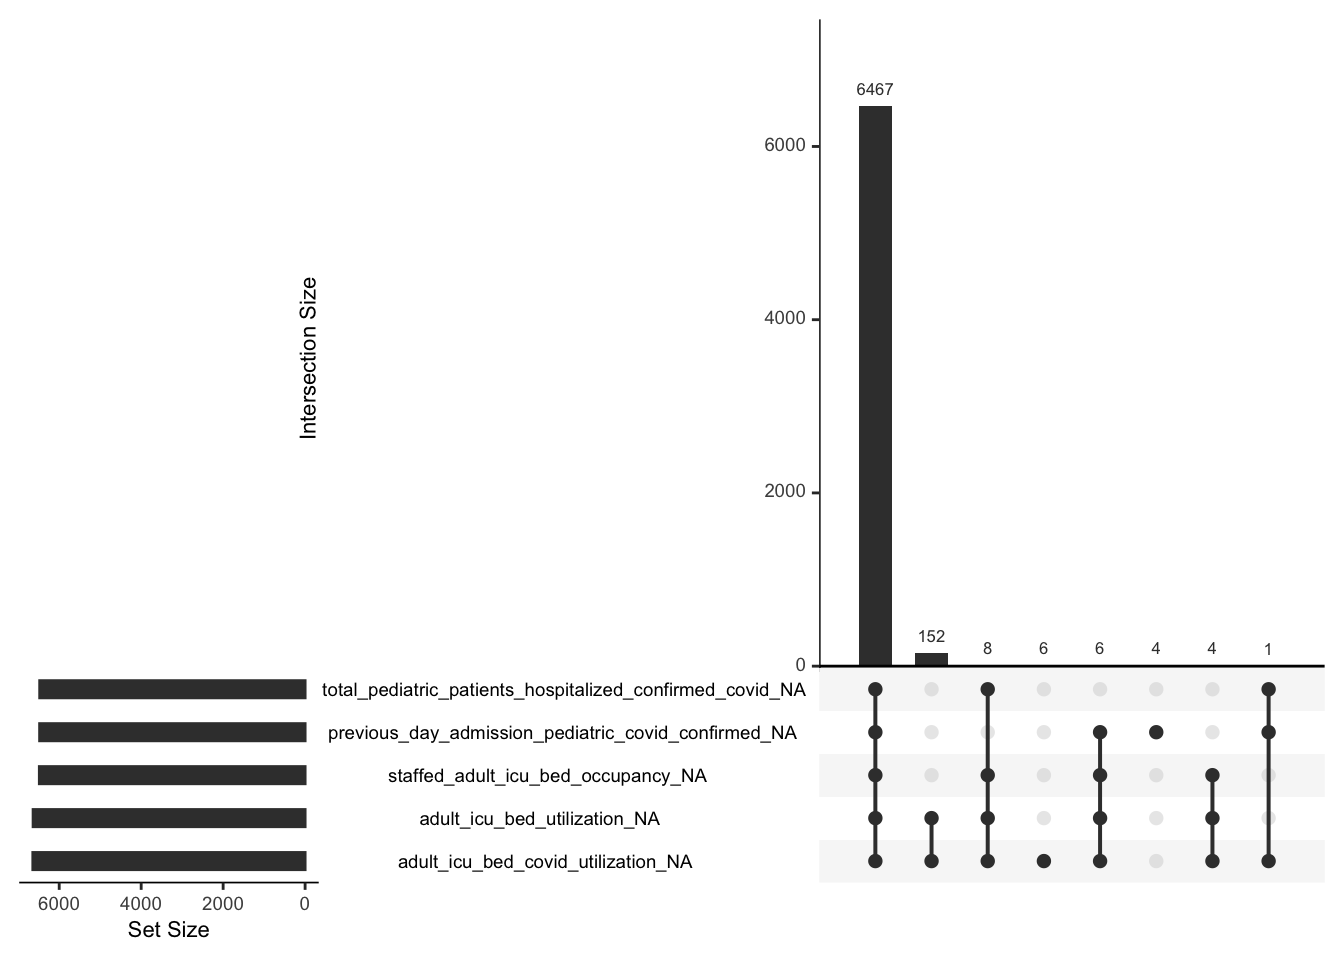
An upset plot from the UpSetR package can be used to visualize the patterns of missingness, or rather the combinations of missingness across cases. To see combinations of missingness and intersections of missingness amongst variables, use the gg_miss_upset function:
6467 cases missing those five columns together;
152 cases missing adult_icu_bed_occupancy and adult_icu_bed_covid_utilization_NA.
What we need to note is that most missing values are from those five variables and they always show missing values together. This is what we need to consider in our following analysis.